
The traffic dashboard shows how many people visit the client’s site and where they come from, using the client’s Google Analytics 4. Connect Google Analytics first.
Steps
-
Open the client’s project and go to Traffic › Traffic overview.
-
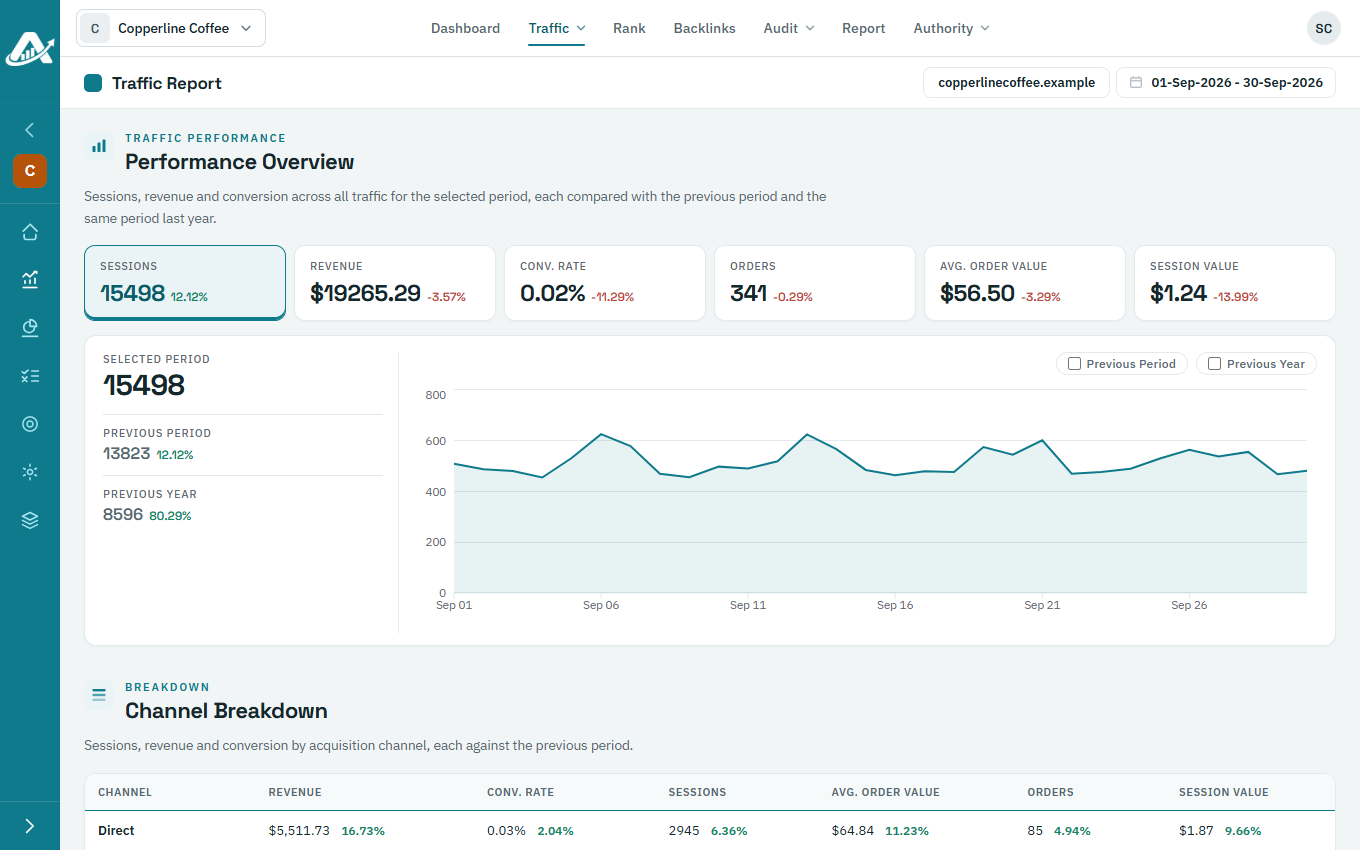
Performance Overview shows sessions, revenue and conversion rate for the dates you’ve chosen, each compared with the period before and the same dates last year.
-
Scroll down to see visits by channel (Channel Breakdown), by device (Sessions By Devices), by source (Source Performance) and by region (Top Regions).