
The SEO dashboard shows the visits that come from search engines, and the sales those visits bring. It uses the client’s Google Analytics 4.
Steps
-
Open the client’s project and go to Traffic › SEO.
-
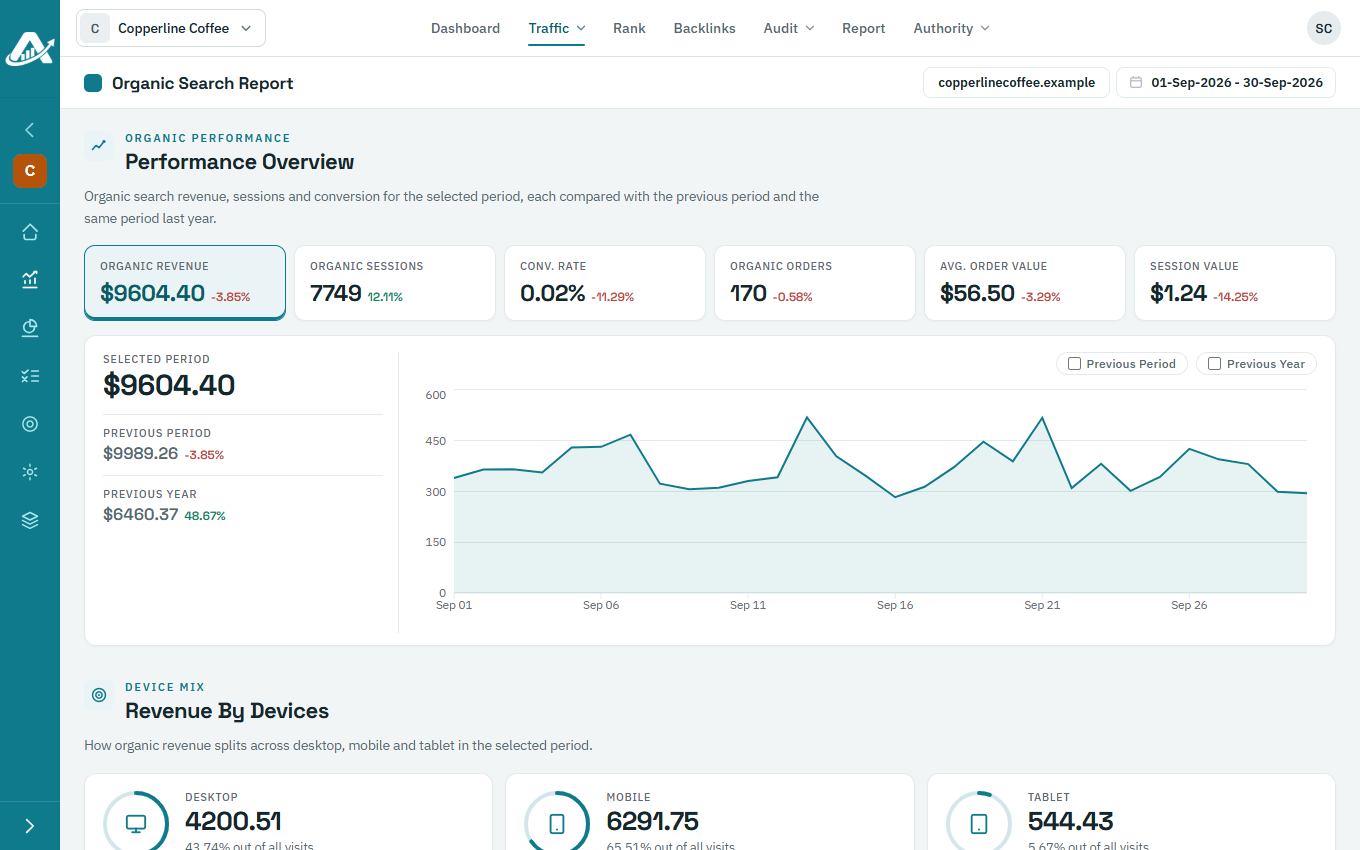
Performance Overview shows organic revenue, visits, conversion rate and orders for the dates you’ve chosen, compared with the period before and the same dates last year. Click a figure to see it on the chart.
-
Scroll down for organic revenue by device (Revenue By Devices) and by browser (Browser Breakdown).