
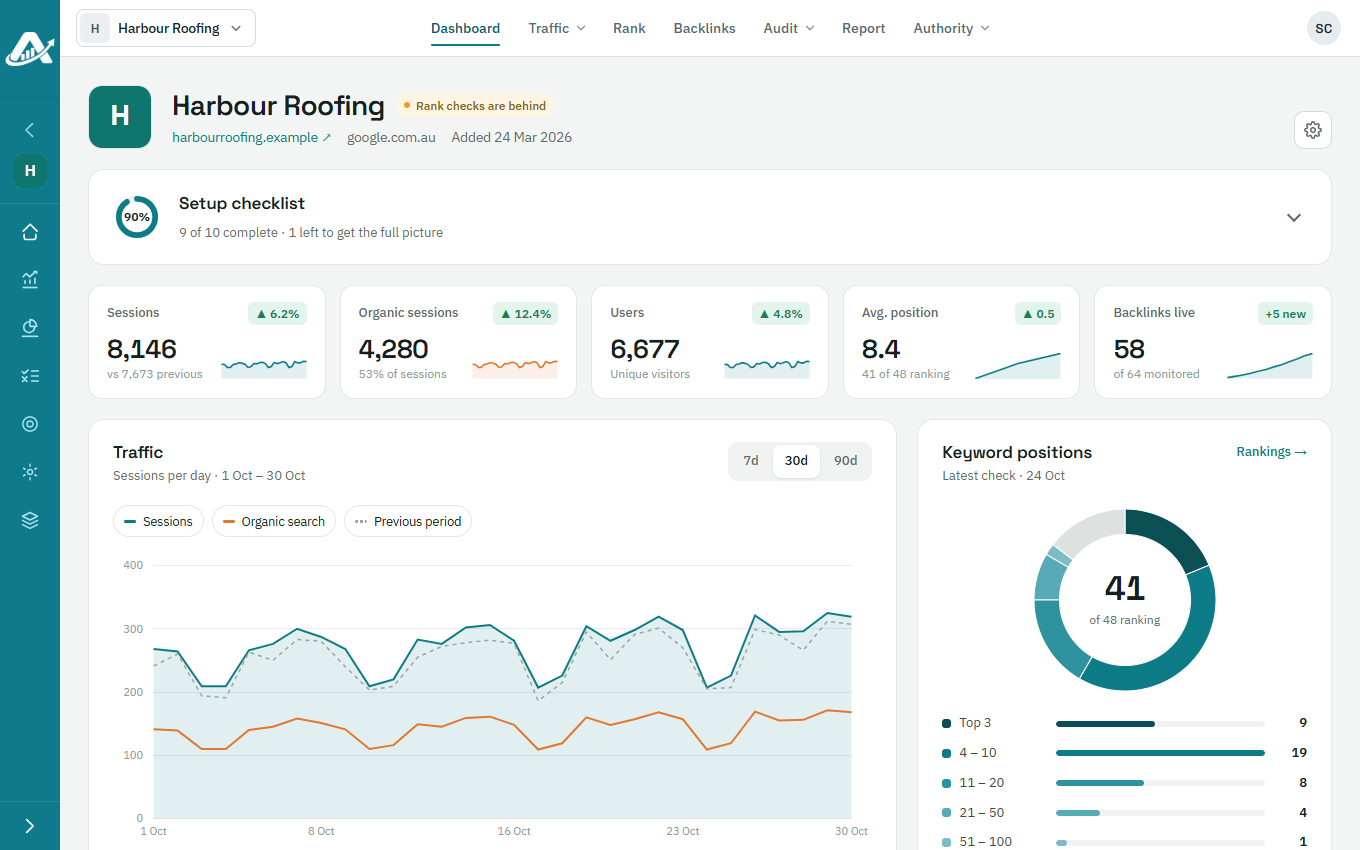
Each client project has a dashboard that shows how the site is doing on one page: its traffic, keyword positions, site audit, reports, content and backlinks.
Steps
-
Open the client’s project. Its Dashboard opens first.
-
The figures along the top give a quick read of sessions, organic sessions, users, average keyword position and live backlinks.
-
Below them, a card covers each service: traffic, keyword positions, site health, crawl history, reports sent, topical authority and backlinks. Click a card’s link to open its full page.
Troubleshooting
- If the figures say Connect GA4, the client’s Google Analytics isn’t connected yet. See How to connect Google Analytics 4 to a client project.